
The success of infographics today is mainly rooted in the fact that humans are extremely visual creatures. There are several types of infographics used in the workplace, in educational books, and even as social media posts to get a point across clearly — this is why brilliant marketers take advantage of the power of infographics to generate more attention to their brand.
Infographics are incredible materials that can make any complex idea much easier to understand. Instead of overwhelming your audience with loaded texts, infographics are the best alternative to relay information to the public.
3 Benefits of Infographics
1. Shareable Content
On average, the attention span of humans only lasts up to 8 seconds. Luckily, infographics have the ability to draw the attention of your viewers for more than that.
Infographics are the most effective tools when it comes to sharing valuable information online. If the infographic is both entertaining and informative, there is a high chance that your audience will share it on their social media platforms and spread the message on your behalf.
2. Increase Sales
Visually stimulating infographics have a higher impact to grab the attention of the viewer more than texts could ever do. Instead of writing about how great your products and services are, infographics are a better option to present them.
This makes infographics one of the best sales tools to use to persuade your audience to purchase your product or services.
3. Great Storytellers
Data-driven contexts are too one-dimensional for a highly digital era. In order for your audience to pay attention to your story, you can bring them to life through bright and lively infographics.
There are different types of infographics you can use to generate storybook content that can increase your traffic online.
5 Types of Infographics
Choosing the best type of infographic to use depends on what kind of information you want to display. Here are a few examples of highly used infographics that will generate attention for your brand:
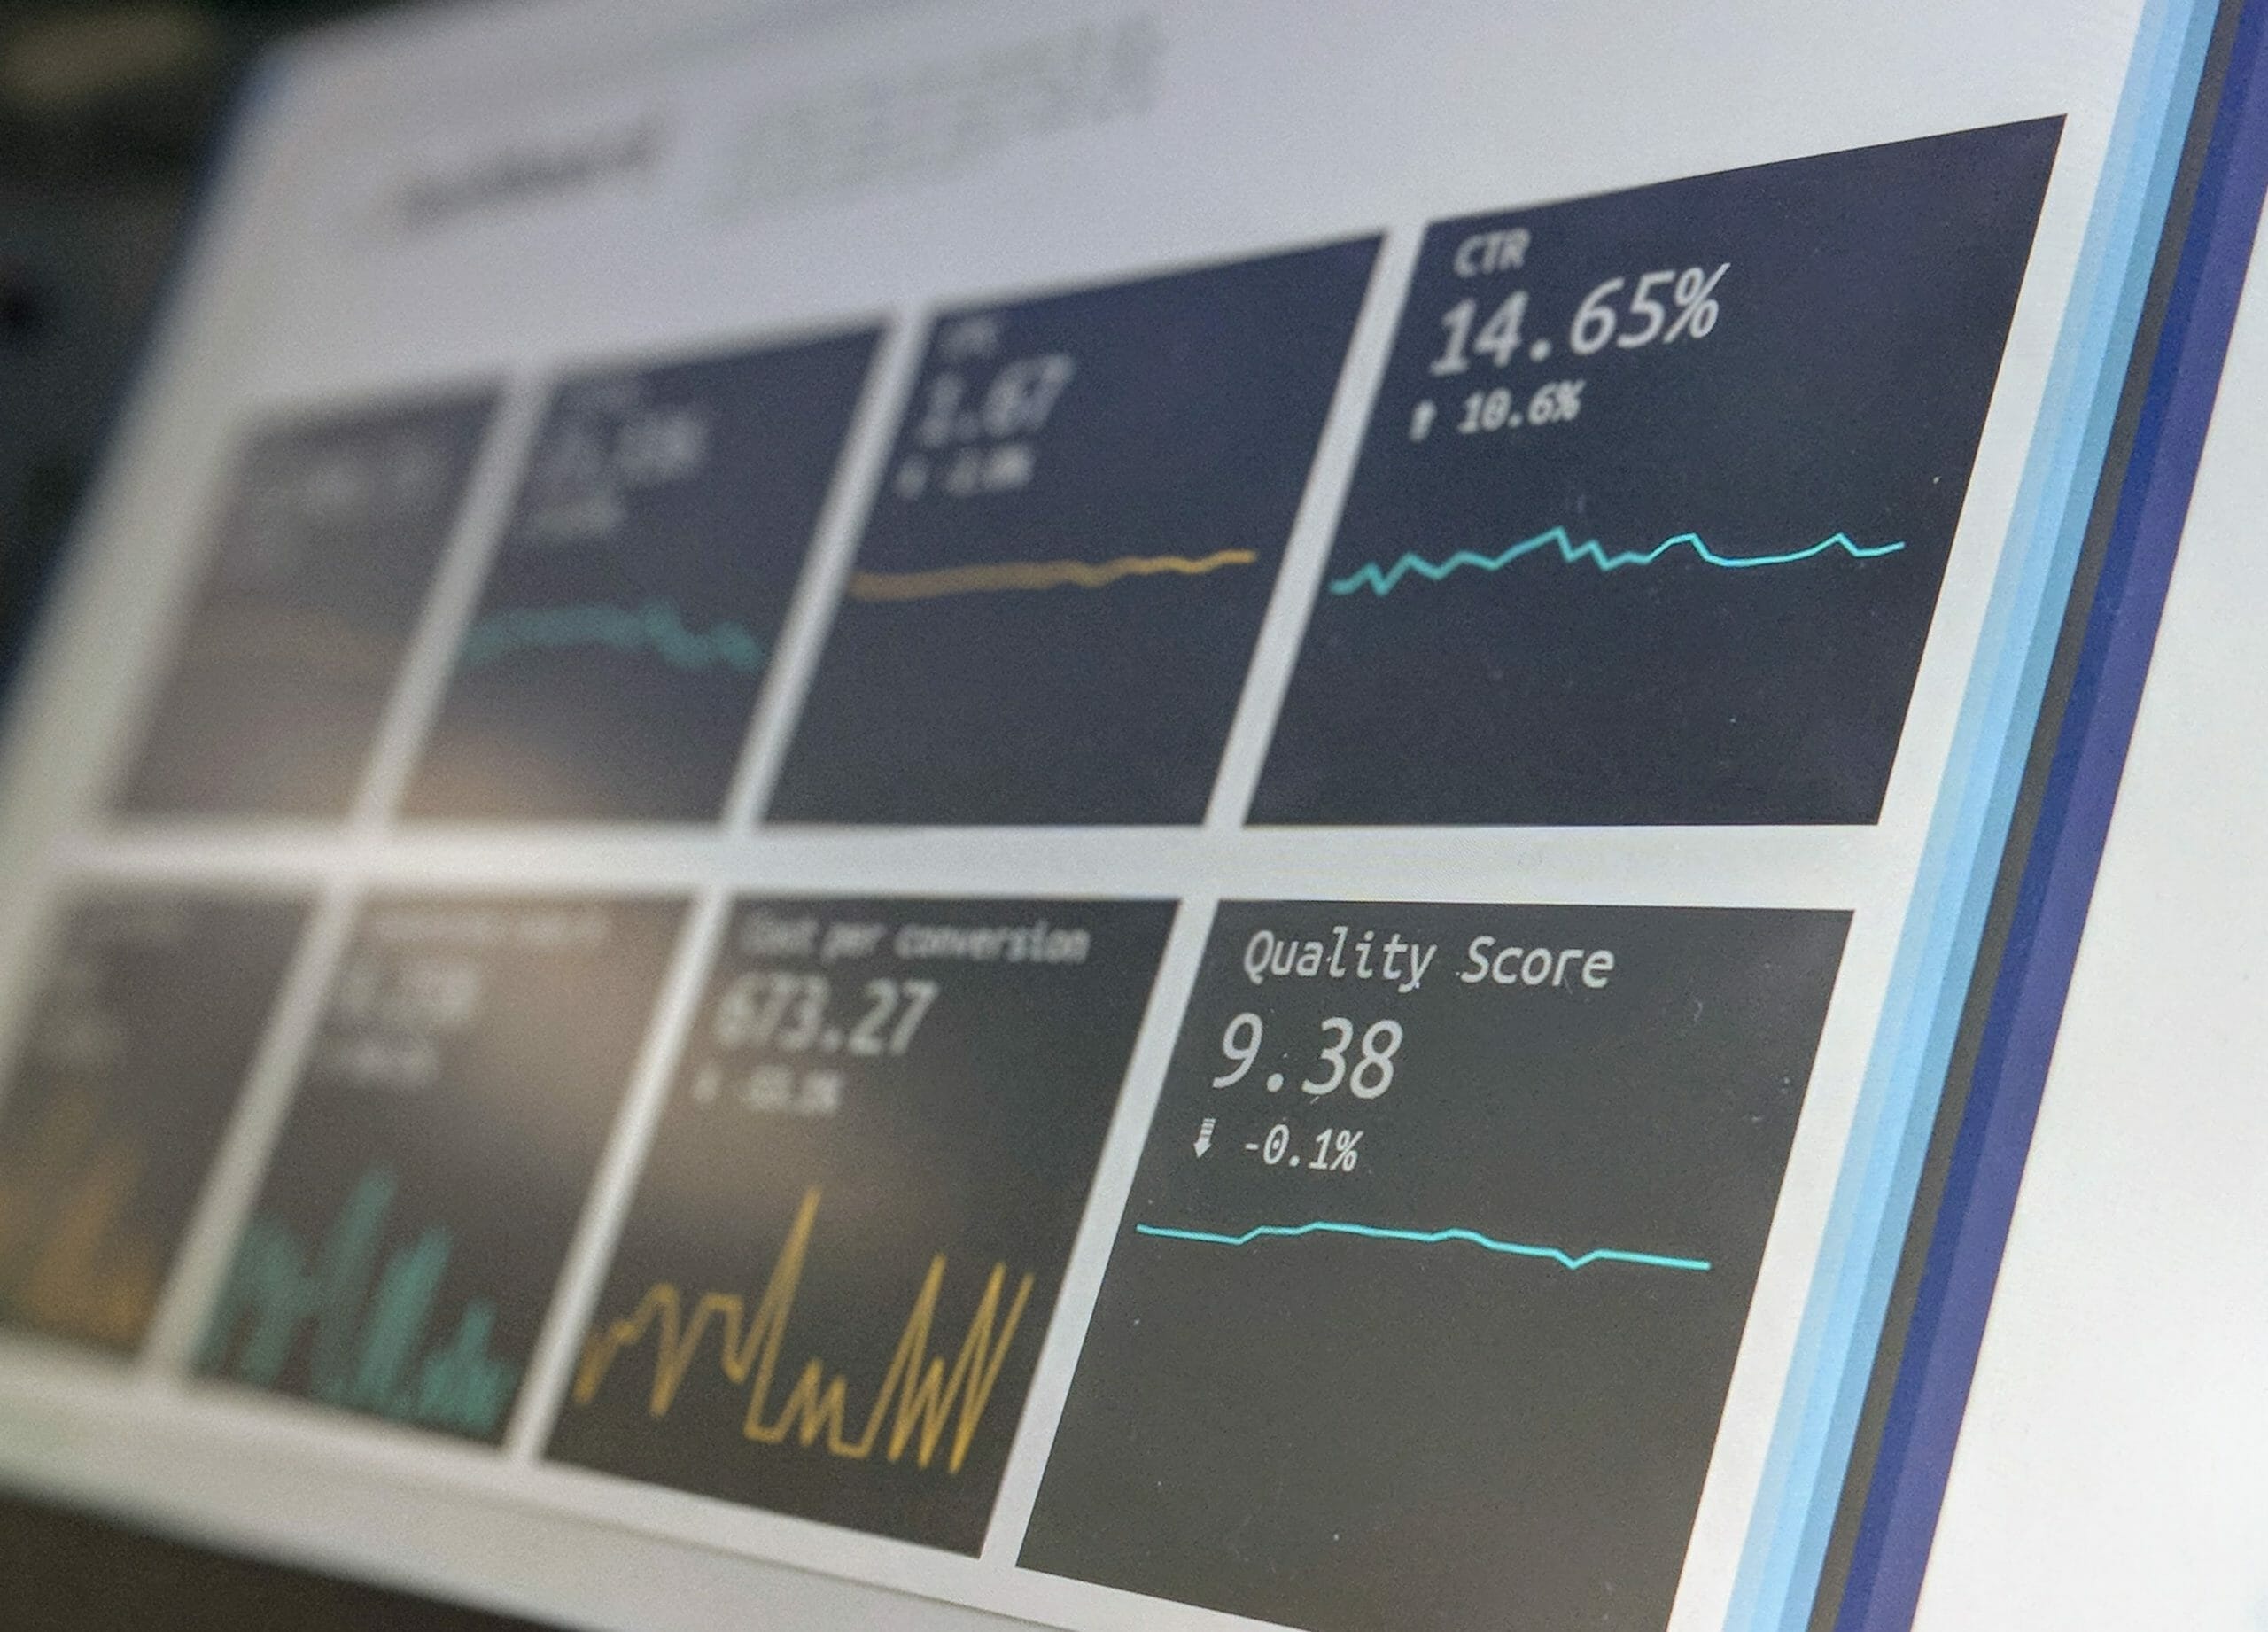
1. Statistical Infographic
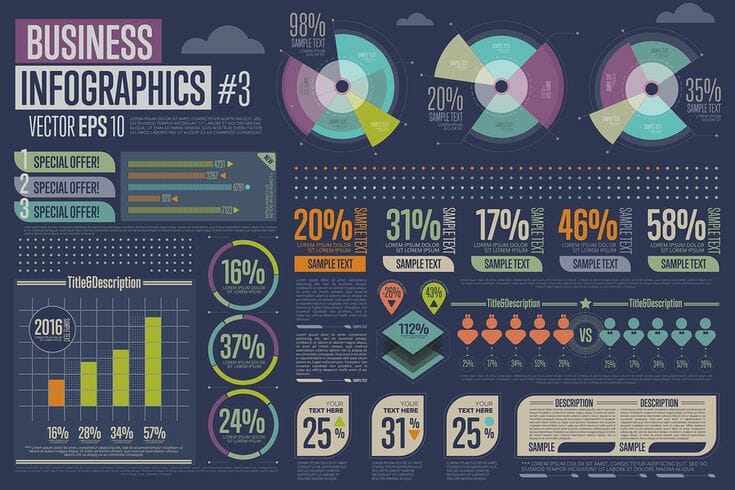
A statistical infographic is focused on data visualization. This is ideal to use if you want to present a solution to an argument with relevant data statistics that support the answer through playful charts, pies, icons, or graphs.
Rather than presenting valuable information through a one-dimensional approach, adding graphic elements to help enhance your idea will keep the viewer engaged and interested in the solution.
Types of charts you can use:
- Pie charts
- Bar charts
- Area charts
- Doughnut charts
- Line charts
- Bubble charts
- Word clouds
- Pictographs
- Scatter plot charts
2. Flowchart Infographic
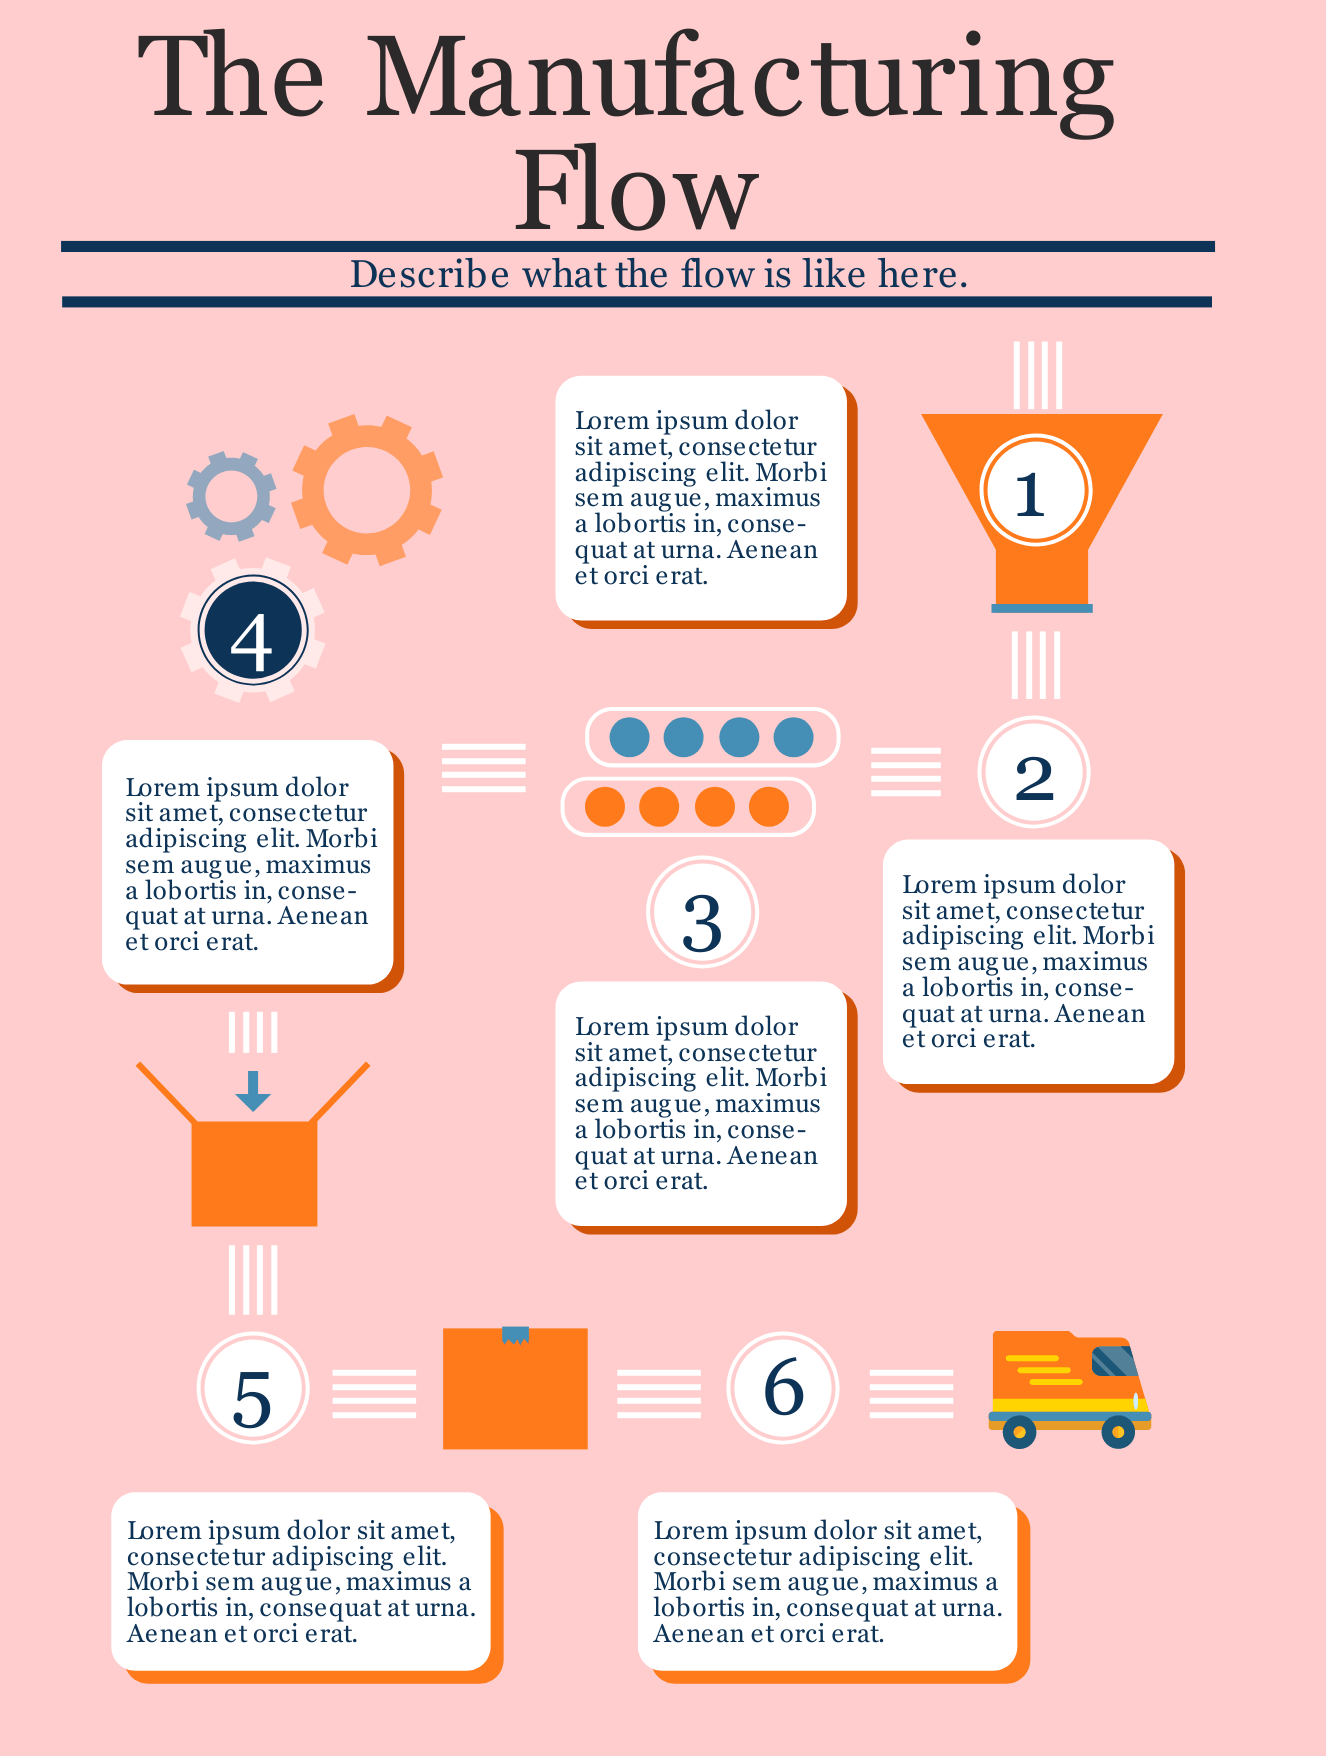
One of the most useful types of infographics has got to be the flowchart. A flowchart infographic is a step-by-step instruction that utilizes visual cues to provide the viewer a detailed manual that is easy to follow.
Every essential step is connected by arrows or dots that show the user the proper sequence, procedure, or step.
3. Hierarchical Infographic
Hierarchical infographics arrange information from greatest to least. This type of infographic is used to display information through pyramids or charts that follow a specific order.
The commonly used example is Maslow’s Hierarchy of Needs. The most important human needs are placed at the base of the pyramid; as it progresses the least important human needs are placed at the smallest segment at the top.
4. Timeline Infographics
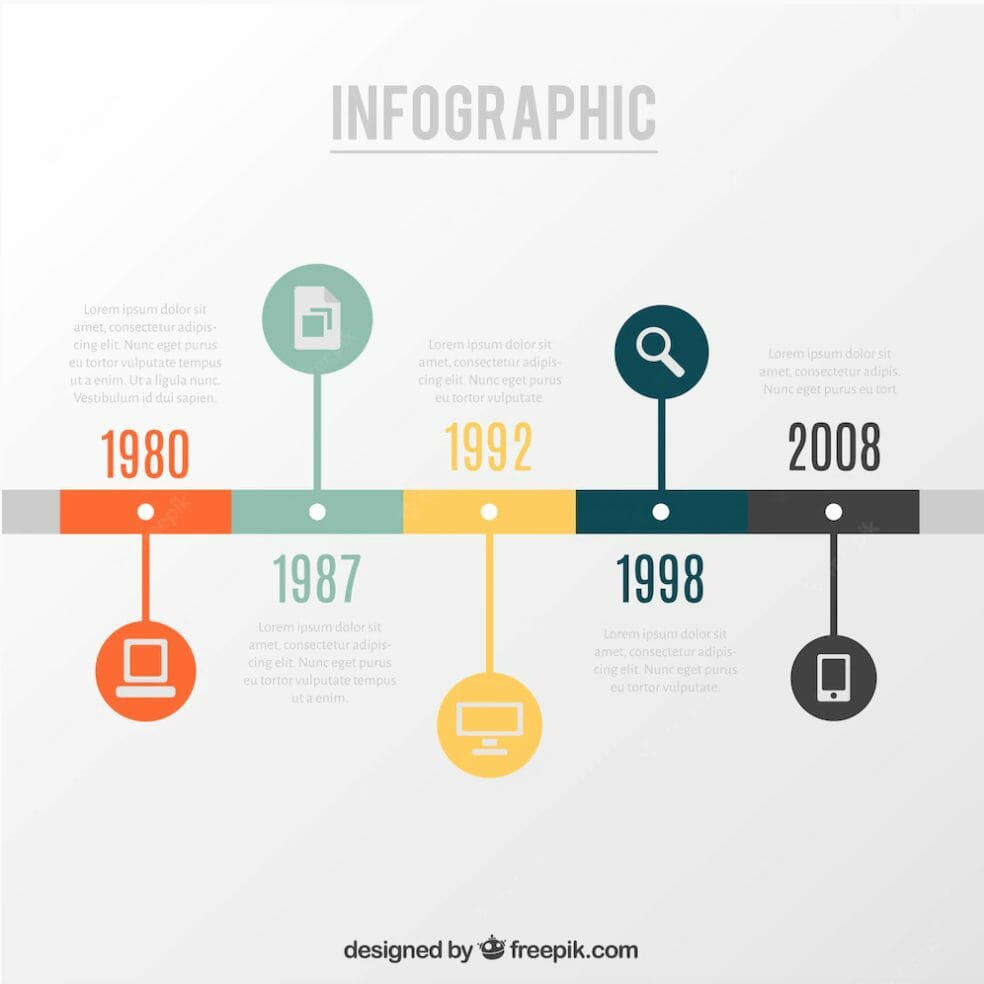
If the intention of your infographic is to visualize the history of a certain event or to highlight an essential date, the best type of infographic to use is timeline infographics.
Since humans are visual creatures, timeline infographics can simplify complex information by making it fun and easier to absorb.
5. Comparison Infographics
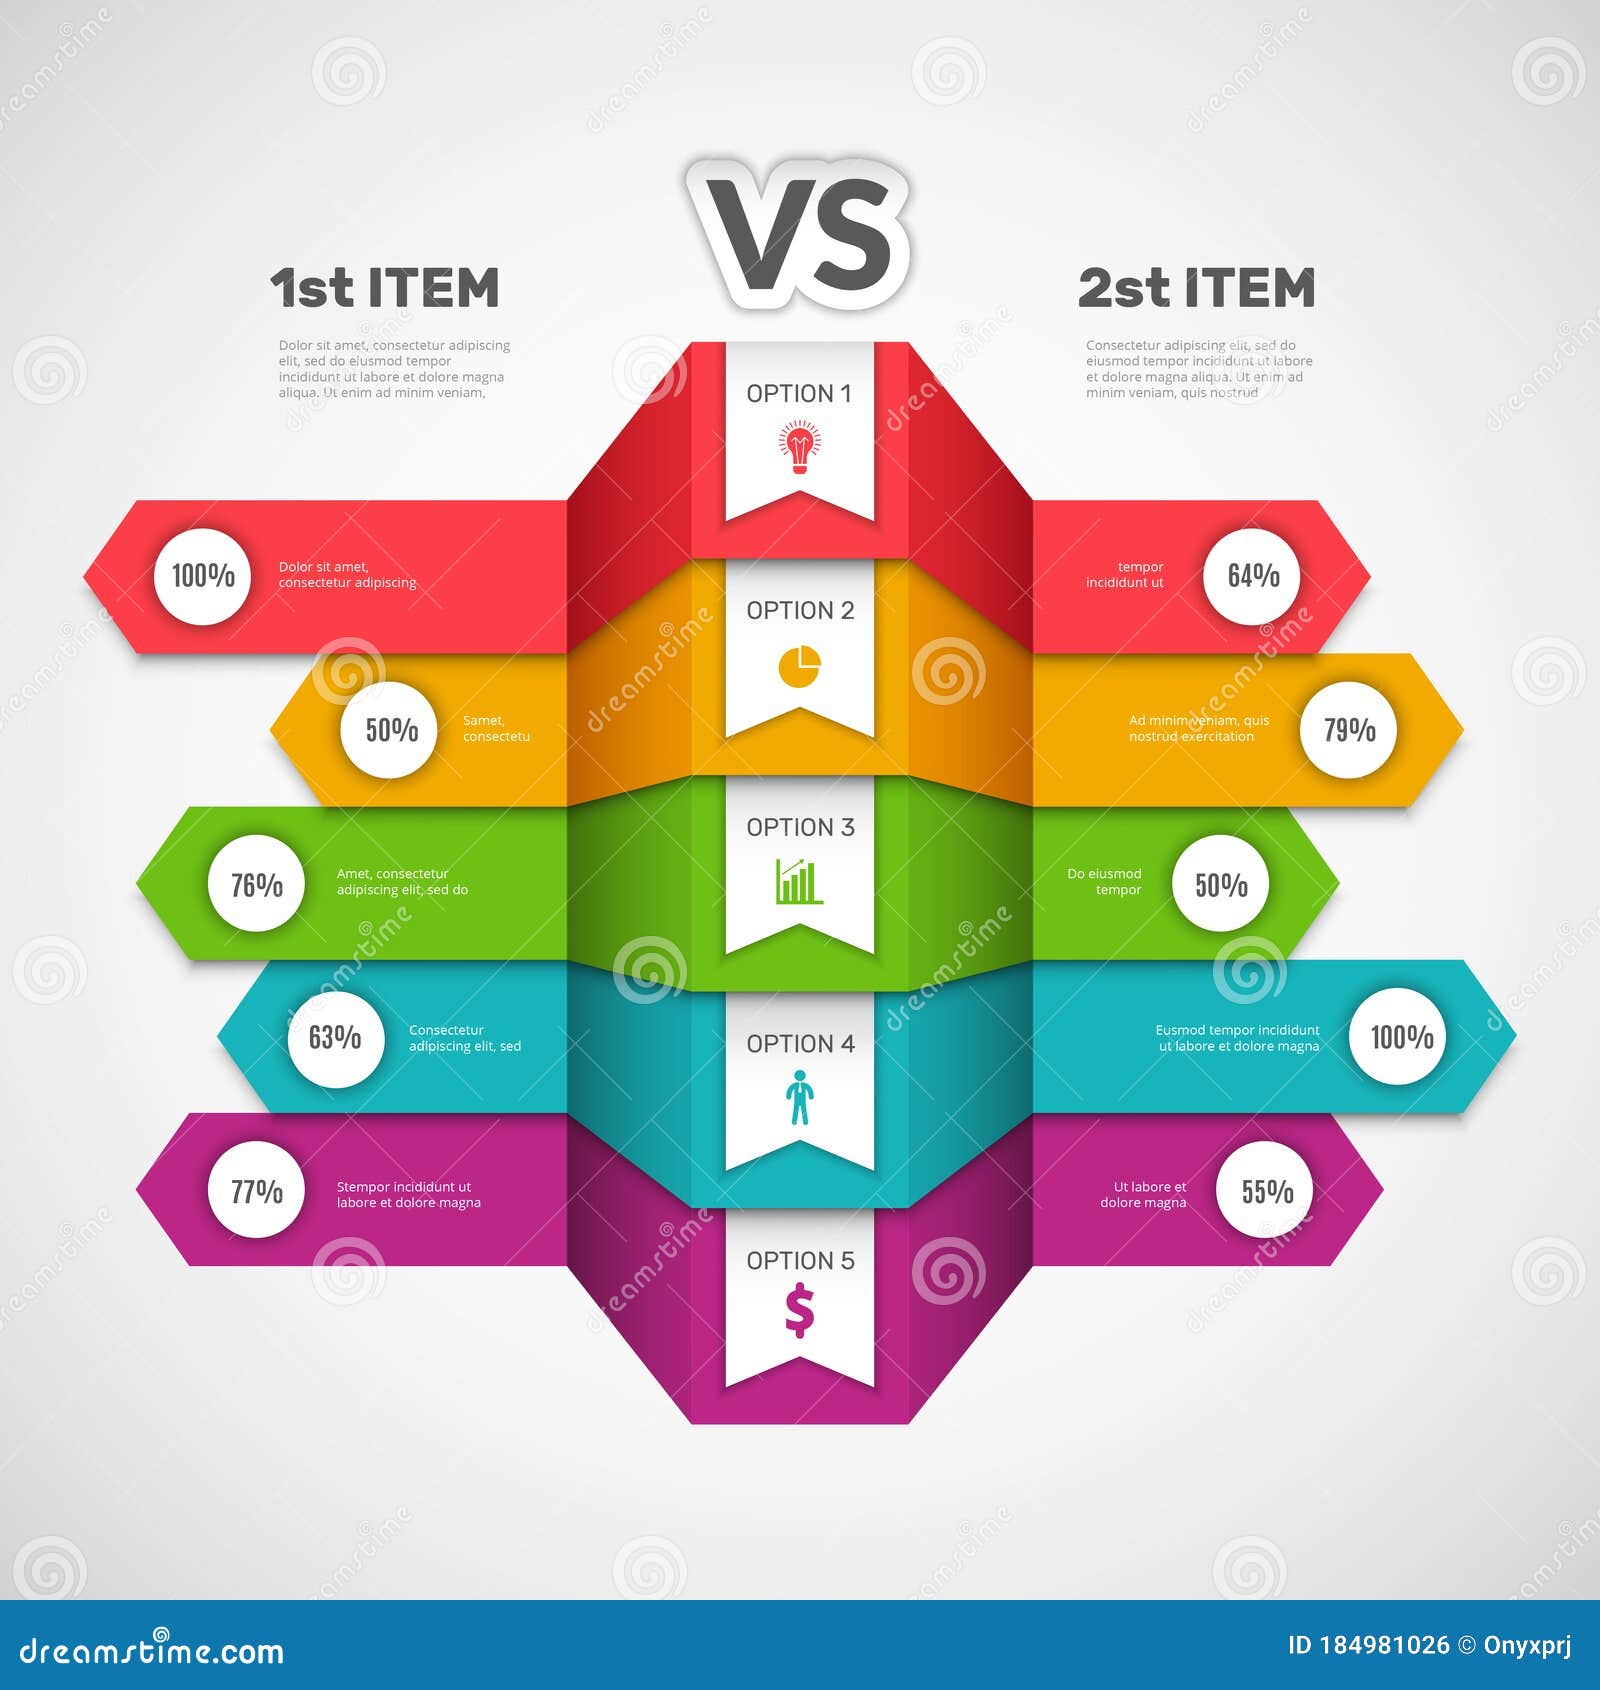
Having multiple options to choose from is always tricky. To compare these options and make it seem like one option is better, comparison infographics are the right style to choose for the job.
These infographics display both data into two sections – they are split down in the middle either vertically or horizontally.

Choosing the right font and color for the job
To generate more traffic, critical elements like the color and font used need to be eye-catching and convincing in order to stand out.
Typography

Fonts can easily be overlooked, but they actually play a huge role in the overall tone and mood of the final design. Choosing the wrong font can ruin the flow of the design and leave a good or bad impression on the mind of the viewer.
Types of Fonts
1. Serif Fonts are known as a traditional font commonly used in magazines, law firms, and financial institutions because of their supreme tone. Examples: Times New Roman, Baskerville, EB Garamond
2. San Serif Fonts are minimalist fonts that are modern and easy to read. Examples: Open Sans, Arial, Helvetica
3. Slab Fonts are bolder and more dramatic fonts perfect for book covers, logos, and posters. Examples: Rockwell, Memphis Serifa
4. Script Fonts resemble a person’s handwriting and it is used to add more dynamism and energy to the mix.
5. Handwritten Fonts are informal fonts that combine both sophistication and eccentric to create a playful font that is used for social media posts, banners, or book covers.
Color

The most noticeable feature of an infographic is the color scheme. In color psychology, color is said to be more than a just visual experience. It plays an important role in infographics due to its ability to evoke and provoke different emotions towards the viewer.
Here are a few examples of colors and the emotions they bring forth:
- Purple is the color known for luxury and wealth.
- Orange symbolizes enthusiasm, warmth, and wholesomeness.
- Blue has extraordinary calming powers. It symbolizes the sky and is known to be trustworthy, friendly, and loyal.
- Yellow adds a sense of joy, optimism, and happiness to the image without being too overpowering.
- Red has always been the symbol of power, confidence, and passion.
Whenever you are choosing the theme of your design, consider the emotions each color invokes and the objective. For branding purposes, it’s best to stick to the color of your brand for consistency purposes.
Unlimited Graphic Designs with DotYeti
Whichever direction you choose to go with your infographics, our design nerds here at DotYeti will surely be able to help you out! Go ahead and visit our pricing page for more info.


![The 10 Best Design Tools To Create A Quick Infographic [+Bonus]](https://www.dotyeti.com/wp-content/uploads/2022/12/The-10-Best-Design-Tools-to-Create-a-Quick-Infographic-1-scaled.jpg)
")